Adept Events
  • Home
  • Event Info
    • Customer service / FAQ
    • In-house Info
    • Online and Live Streaming
    • Sponsoring
    • Terms and Conditions
  • Speakers
  • Contact us
    • Contact us
    • Customer service / FAQ
    • Call for speakers DW&BI Summit
    • About us
    • Newsletter
    • Materials upload
  • English
    • Dutch
Watch Video

Datavisualisatie en Data Driven Storytelling

(Dutch spoken)

Date Price Contact
May 18, 2021 € 550,- seminars@adeptevents.nl
+31 (0)172 742680
Time Location
9:00 - 16:30 Virtual classroom
Next EditionTYPE
November 9, 2021 Online only
Date Price
May 18, 2021 € 550,-
Time
9:00 - 16:30
Location Contact
Virtual classroom seminars@adeptevents.nl
+31 (0)172 742680
Next Edition
November 9, 2021
TYPE
Online only
Date
May 18, 2021
Price
€ 550,-
Time
9:00 - 16:30
Location
Virtual classroom
Contact
seminars@adeptevents.nl
+31 (0)172 742680
Next Edition
November 9, 2021
TYPE
Online only
  • Overview
  • Speakers
  • Venue

Datavisualisatie en Data Driven Storytelling

[Due to corona restrictions we only have a limited number of seats available. Please register early! To provide the live video stream in the hybrid format, we require a minimum of three online attendees.

If corona restrictions prevent us from running on-site or hybrid, we will revert to virtual delivery.]


Binnen de moderne informatievoorziening is het gebruik van visualisaties niet meer weg te denken. Sinds jaren worden de theorieën van Stephen Few en Edward Tufte toegepast in BI tools. Maar de uitdagingen vandaag de dag zijn groter dan “welke kleur moet ik gebruiken” of “welke grafiekvorm past het best bij deze boodschap”. Vragen van nu zijn “Hoe krijg ik deze boodschap goed gecommuniceerd?”, “Hoe kan ik zoveel data duidelijk presenteren?” of “Welke rollen voor visualisatie heb ik nodig in mijn Analytical Center of Excellence?”

Nuts and Bolts of Chart TypesDe workshop

De workshop “Datavisualisatie – De logische stap naar inzicht” zal naast de basistheorieën, zoals visuele perceptie, gestallt wetten en kleurtheorieën, belangrijk inzicht geven in de hedendaagse uitdagingen binnen uw organisatie. Hoe om te gaan met grote hoeveelheden data, de noodzaak van storytelling, de opkomst van de data-artist, de nieuwe plek in de organisatie, de relatie met predictive/advanced analytics en dergelijke vraagstukken.

De vele visualisatietools die op dit moment op de markt zijn, komen uitgebreid aan bod. Welke tools zijn online beschikbaar en kunnen relatief makkelijk gebruikt worden? Moet men kunnen programmeren om een tool te gebruiken? Moeten wij kiezen voor Tableau, voor PowerBI of voor een totaal andere tool? Allemaal vragen waar de huidige data gedreven organisaties mee te maken hebben. Vele praktijkvoorbeelden passeren de revue over organisaties die deze tools gebruiken voor hun analytics uitdagingen.

Door kennis op te doen tijdens deze brede kijk op datavisualisatie, met vele praktijksituaties als voorbeeld, bent u in staat datavisualisatie binnen uw organisatie naar een hoger plan te trekken. Gebruik datavisualisatie om uw management beter te informeren en geef inzicht in plaats van informatie.

Leerdoelen

  • Kennis van verschillende visualisatietheorieën
  • Overzicht van de belangrijkste auteurs, visies en meningen op het gebied van visualisatie
  • Overzicht van verschillende visualisatietools zoals o.a. Tableau, QlikSense en PowerBI
  • Kennis opdoen van het juiste gebruik van grafieken (welke, wanneer en waarom)
  • Het fundament leren van dashboards (user design, rules, do’s & don’ts)
  • De rol van visualisatie binnen de organisatie begrijpen
  • De link kunnen leggen naar big data, advanced analytics en data science
  • Hands-on ervaring met het Data Driven Storytelling proces.

Bestemd voor ú

Deze workshop is bestemd voor iedereen die binnen de organisatie betrokken is bij het presenteren van data. Dat maakt de workshop geschikt voor functionarissen als business intelligence specialisten, data scientists, business analisten en alle gebruikers van informatie.
De training is niet technisch van aard en voorkennis is derhalve niet vereist. Tijdens de workshop “Data Driven Storytelling” wordt een Excel data bron gebruikt die voor iedereen beschikbaar wordt gesteld. Daarom wordt aangeraden een laptop mee te nemen met daarop een data-analyse tool naar keuze (Excel, PowerBI, Tableau, Qlik Sense, etc.).
Aarzel daarom niet en schrijf u snel in!

Bovenaan de pagina bij Downloads kunt u de volledige PDF brochure downloaden.

Lex Pierik

Managing Director
Think.Design.Make
Lex Pierik started working in the ICT industry in 2000 and by extensive field experiences he quickly grew into his current role as a principal BI consultant. He is a seasoned ICT professional with a particular expertise in both the conceptual as well as the technical complexities of BI challenges.

Read more

The virtual seminars and workshops will be offered through an online meeting platform, usually Webex or Zoom, from our video studio. The virtual classroom is equipped with multiple professional cameras and microphones and we have a two person crew available so that we can offer a similar experience to that of the traditional classroom and, more important, still offer adequate interaction with the speaker.

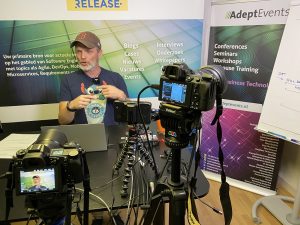
The presenter / trainer will still use his Powerpoint, combined with flipchart and paper, virtual whiteboard and physical whiteboard and will be accompanied by a operator / moderator at the scene. The presenter does not have to worry about technical issues such as switching, splitting, microphone settings and such but can fully focus on the course material and on engaging with the online attendees.

  • When using the flipchart, the moderator will take care of switching scenes and camera perspective and of switching to attendees to ask questions.
  • When switching to flipchart you will have full view of the presenter and of the flipchart with all text and diagrams crystal clear.
  • And since the presenter / trainer is equipped with a wireless lapel microphone and the questions of the participants enter the course room clearly understandable (amplified), he can answer those questions from anywhere in the classroom and from any camera angle.
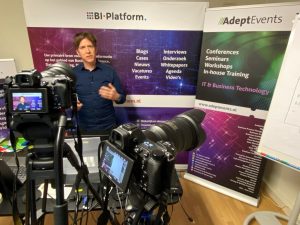
  • Asking questions and the speaker answering them can therefore be done just like you are used to in a regular classroom.
  • Because the course room is equipped with at least four monitors, the speaker/trainer also has a view of the online participants during the meeting.
  • For some (international) speakers we may use their own virtual course room with similar facilities but we will send the invite ourselves and the meeting will run on the Adept Events online meeting platform.

All of the above is to ensure that it does not become an impersonal one-way webinar but an interactive virtual classroom setting.

Those attending an online event or a hybrid event with the online meeting platform will be sent an invitiation with the meeting hyperlink and instructions a few days before, so well in advance of the course.

In-house Info

Practically all of our seminars and workshops can be offered as an In-house course for your company exclusively. We can tailor with extra focus on specific topics that apply to your organization. Also available in online format or in face-to-face format with live video stream.

MORE INFO

RELATED EVENTS

14-05-2025
Register now!

Ontwerpen van een Nieuwe Data Architectuur

Stappenplan en best practices Organizations need data science, self-service BI, embedded BI, edge analytics, and customer-driven BI. This seminar provides guidelines, roadmaps, design criteria, tips, design rules, use cases, case studies, and practical examples for developing a new future-proof data architecture.

Rick van der Lans

 May 14-15, 2025

Utrecht

View

Adept Events
KvK Den Haag: 56059825
E: seminars@adeptevents.nl
T: +31 (0)172 742680
M: +31 (0)6 113 118 60
W: www.adeptevents.nl

Release
www.release.nl
@Release_nl
Download the Release App

BI-Platform
www.biplatform.nl
@BIPlatform
Download the BI-Platform App

© Adept Events is a registered trademark of Array Media B.V.
Share to Twitter Share to Facebook Share to LinkedIn
© 2025 Array Media b.v. - All rights reserved | Privacy | Disclaimer